Walking into your first data analyst interview straight out of university or a bootcamp can feel overwhelming. When you lack a multi-year corporate resume, it is easy to assume hiring managers expect you to possess encyclopedic knowledge of machine learning algorithms, advanced Python automation, or complex cloud database architecture.
The reality is entirely different. Hiring managers recruiting freshers—whether for a Fortune 500 product company or a fast-paced agency—are not looking for seasoned data architects. They are assessing your foundational logic, coachability, and attention to detail. They want to know if you can clean a messy Excel sheet without deleting crucial records, write a basic SQL query to extract daily sales, and clearly explain your university capstone project to a non-technical manager.
This guide provides a comprehensive breakdown of the exact junior data analyst interview questions for freshers. By mastering these core technical and behavioral concepts, you will transition from an academic candidate to a confident, job-ready data professional.
Quick Answer: What Hiring Managers Expect from Freshers
For an entry-level or junior data analyst role, the interview process heavily prioritizes fundamentals over advanced tech stacks.
| Skill Category | Fresher Expectation Level | Core Tools Assessed |
|---|---|---|
| Spreadsheets | High. Must know data manipulation and referencing. | Excel (XLOOKUP, Pivot Tables, Filters) |
| Databases | Moderate. Must retrieve and group data reliably. | SQL (SELECT, JOIN, GROUP BY, WHERE) |
| Logic & Stats | Moderate. Understanding distributions and cleaning. | Math, Basic Statistics, Logic Puzzles |
| Programming | Low to Moderate. Basic syntax and data frames. | Python (Pandas basics) or R |
| Visualization | Low. Knowing which chart to pick for a dataset. | Tableau, Power BI, or Excel Charts |
Never lie about knowing an advanced tool on your fresher resume. If you claim to know advanced Python but fail a basic loop question, you will be rejected. It is always better to claim "Intermediate Excel and Basic SQL" and answer those foundational questions flawlessly.
Why This Matters
The transition from academic datasets to real-world business data is the biggest hurdle for freshers. In university, datasets are perfectly clean and designed to give you a clear, correct answer. In a corporate environment, data is messy, missing, duplicated, and contradictory.
Interviewers use entry-level questions to test your "data intuition." They want to see if you instinctively check for duplicates, handle missing values cautiously, and understand the basic business reason behind the data you are pulling before you write a single line of code.


Crack Data Analyst Interviews with Real Company Questions
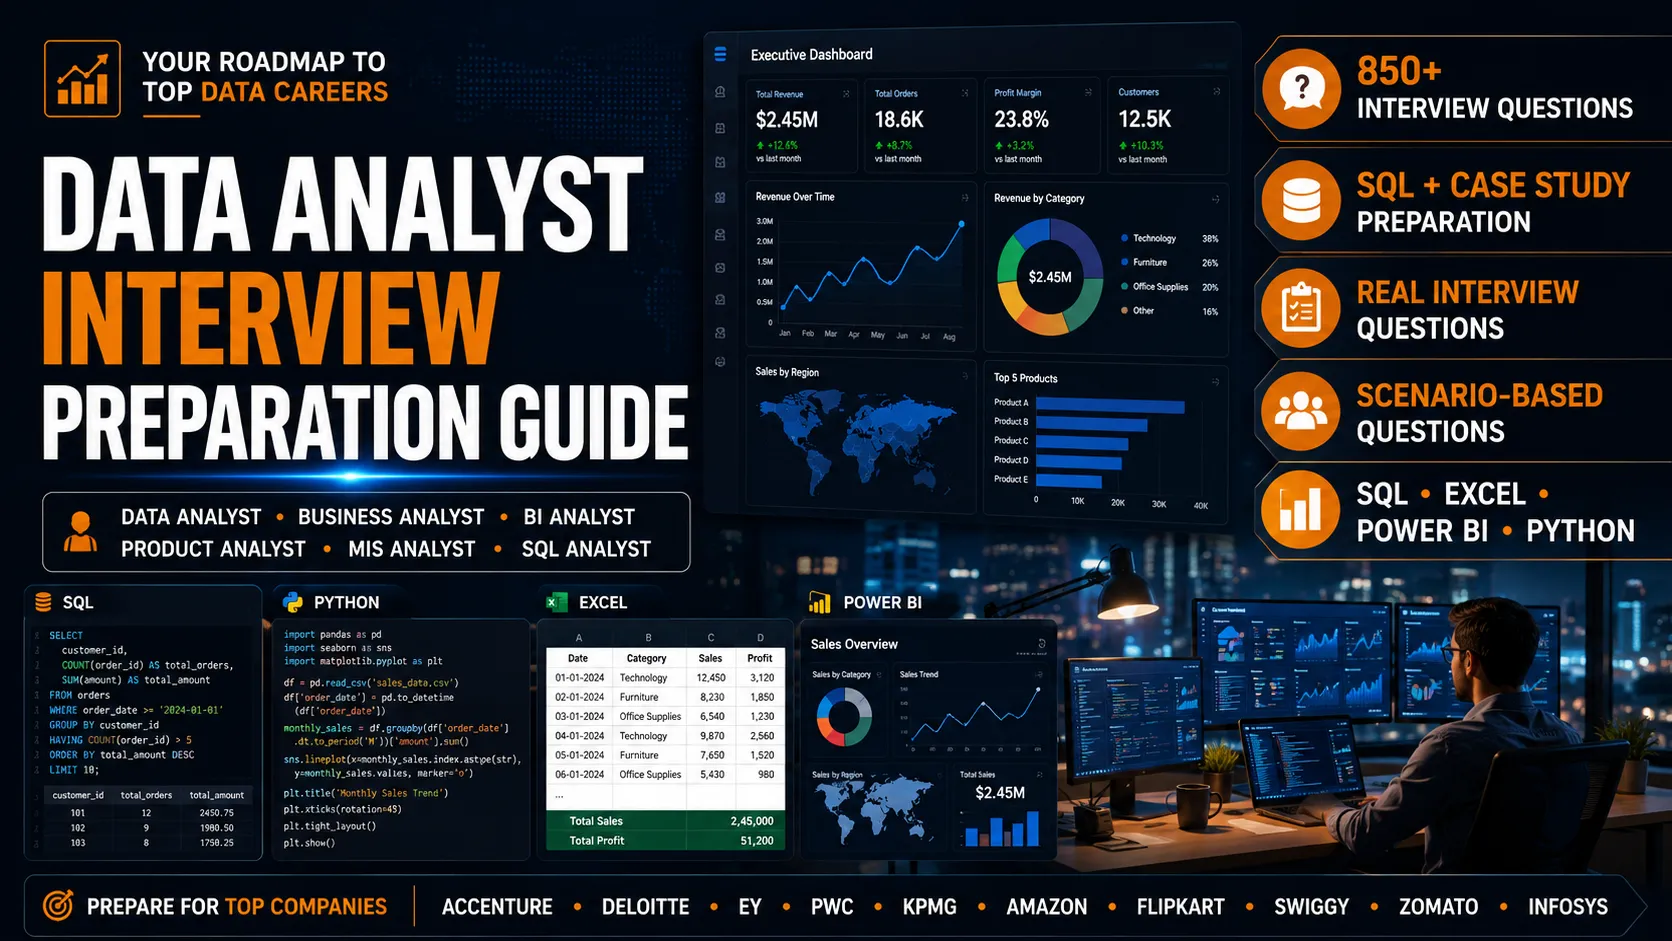
Access 850+ curated Data Analyst interview questions covering SQL, Excel, Power BI, Python, Business Analytics & Case Studies — inspired by interviews at top companies and MNCs. Designed to help freshers and professionals prepare smarter for real interviews.
Inspired by Interview Trends Across
Excel & Spreadsheet Questions (The Fresher Foundation)
Before any company trusts you with their live SQL database, they will test your proficiency in spreadsheets. Excel remains the universal language of business data.
1. What is the difference between VLOOKUP and XLOOKUP?
Direct Answer: VLOOKUP searches for a value in the first column of a table array and returns a value in the same row from a specified column to the right. XLOOKUP is a modern replacement that can search in any direction (left or right), defaults to an exact match, and can return custom text if no match is found without needing a separate IFERROR wrapper.
Interviewers ask this to see if your skills are modern. Mentioning XLOOKUP or INDEX-MATCH shows you go beyond outdated academic syllabuses and keep up with current software capabilities.
2. How do you find and handle duplicate records in a dataset?
Structured Explanation:
-
Identify: I would select the dataset, navigate to the 'Home' tab, and use 'Conditional Formatting > Highlight Cells Rules > Duplicate Values' to visually inspect the duplicates.
-
Verify: I would check if the row is a true duplicate (every single column matches) or just shares an ID (e.g., the same customer making two different purchases on the same day).
-
Remove: If it is a true data entry error, I would use the 'Remove Duplicates' feature under the 'Data' tab, ensuring I keep the unique identifier column selected to preserve data integrity.
3. Explain what a Pivot Table is and when you would use one.
Quick Definition: A Pivot Table is an interactive data summarization tool in Excel that automatically sorts, counts, totals, or averages data stored in a massive spreadsheet, allowing you to view the data from different perspectives without writing complex formulas.
SQL Interview Questions for Freshers
SQL is mandatory for junior roles. You won't be expected to optimize database architectures, but you must know how to pull, filter, and join data accurately.
4. What is the difference between WHERE and HAVING?
Direct Answer: The WHERE clause filters individual rows before any grouping or aggregations are calculated. The HAVING clause filters aggregated data after the GROUP BY clause has been applied.
Example Code:
-- Filtering rows BEFORE grouping (WHERE)
SELECT department, SUM(salary) FROM employees WHERE status = 'Active' GROUP BY department;

-- Filtering aggregated results AFTER grouping (HAVING)
SELECT department, SUM(salary) FROM employees GROUP BY department HAVING SUM(salary) > 500000;
5. Explain the different types of SQL JOINs.
Returns only the rows where there is a match in both tables. This is the default and most common join.
Returns all rows from the left table, and the matched rows from the right table. Unmatched rows from the right will show as NULL.
Returns all rows from the right table, and the matched rows from the left table.
Returns all records when there is a match in either the left or right table.
6. Write a query to find the second highest salary in an employees table.
Direct Answer: This is a classic logical test for freshers. The easiest, most standard way across modern relational databases is using the LIMIT and OFFSET clauses.
SELECT salary FROM employees ORDER BY salary DESC
LIMIT 1 OFFSET 1;7. How do you handle NULL values in SQL?
Direct Answer: You cannot use standard equality operators (like =) to find NULL values because NULL represents an unknown state, not a zero or a blank space. You must use IS NULL or IS NOT NULL.
COALESCE() function. For example, COALESCE(discount_amount, 0) will return 0 if the discount column is empty, preventing math errors in further calculations.
Crack Data Analyst Interviews with Real Company Questions
Access 850+ curated Data Analyst interview questions covering SQL, Excel, Power BI, Python, Business Analytics & Case Studies — inspired by interviews at top companies and MNCs. Designed to help freshers and professionals prepare smarter for real interviews.
Inspired by Interview Trends Across
Statistics & Data Logic Questions
You must prove you understand the math behind the metrics. A dashboard is useless if the underlying statistics mislead the stakeholder.
8. When would you use the Median instead of the Mean (Average)?
Direct Answer: You use the median when the dataset contains extreme outliers that would artificially skew the average. You use the mean when the data is symmetrically distributed without extreme values.
"If I am analyzing the starting salaries of 10 freshers, and 9 make $50,000 but one makes $250,000, the mean average would look artificially high and misrepresent the group. The median will provide a much more accurate representation of the typical fresher salary in that cohort."
9. What is the difference between categorical and numerical data?
Quick Definition:
Represents characteristics, groupings, or labels. It cannot be mathematically quantified. Examples include gender, city names, product colors, or department codes.
Represents measurable quantities. It can be continuous (e.g., exact height, weight, revenue down to the decimal) or discrete (e.g., number of items sold, number of employees).
Behavioral & Scenario Questions (Handling Lack of Experience)
As a fresher, you don't have years of corporate case studies to pull from. Hiring managers will ask behavioral questions to test your problem-solving mindset, your communication skills, and your honesty.
10. What would you do if a stakeholder asks you a question about the data, and you don't know the answer?
Direct Answer / Strategy: Never guess, and never make up an answer. In data analytics, a wrong answer costs money; a delayed answer only costs time.
11. Walk me through a data project you completed during your university or bootcamp.
Expert Tip: Use the STAR method (Situation, Task, Action, Result) even for academic or personal portfolio projects.
Example Structure:
Common Fresher Mistakes Candidates Make
| Mistake | Why It Fails | What to Do Instead |
|---|---|---|
| Faking Tool Knowledge | Senior analysts can instantly spot when you are pretending to know Python or DAX. | Be honest: "I haven't used Python extensively, but I am highly proficient in SQL and eager to learn." |
| Not Clarifying Questions | Rushing to write SQL code without understanding the business goal leads to wrong outputs. | Ask context questions: "Before I write the query, should I assume the transaction_date is in UTC or local time?" |
| Ignoring Data Cleaning | Freshers often jump straight to making charts and forget that real data is dirty. | Always mention checking for nulls, duplicates, and data type formatting errors first. |
| Speaking Like a Textbook | Reciting exact Wikipedia definitions shows memorization, not understanding. | Use analogies. Explain a JOIN like combining two Excel sheets side-by-side using an ID number. |
Don't just memorize. Practice with Industry Experts.
Theory only gets you so far. Book a 1:1 mock interview with Senior Data Analysts from top product companies and get actionable feedback.
Best Practices for Junior Candidates
Build a Proof-of-Work Portfolio
Do not just rely on your degree or certificate. Complete 2-3 end-to-end projects using open-source datasets (like those found on Kaggle or public government sites). Host them on GitHub or a free portfolio website. Being able to say, "I actually built a dashboard similar to this, here is the link," separates you from 90% of your competition.
Master the Basics, Ignore the Hype
Forget about Artificial Intelligence and Deep Learning for now. A junior analyst who is an absolute master of Excel Pivot Tables and SQL GROUP BY statements is vastly more employable than a fresher who poorly understands neural networks.
Communicate Business Value
Always tie your technical answer back to a business outcome. Don't just say, "I used a pie chart." Say, "I used a visual chart to help the marketing team easily see which region generated the most leads so they could adjust their ad spend."
Final Thoughts
The junior data analyst interview is not a test of perfection; it is a test of potential. Hiring managers want to see that you understand the core mechanics of structured data, that you respect data accuracy, and that you can communicate your findings clearly to non-technical teams. Focus your preparation heavily on SQL joins and aggregations, Excel data manipulation, and the STAR method for behavioral questions. Be honest about what you don't know, emphasize your eagerness to learn, and approach every question as a puzzle to be solved rather than a test to be passed.
Frequently Asked Questions (FAQ)
Not always. While Python is highly valuable, many entry-level roles at major service-based companies rely entirely on Advanced Excel, SQL, and a visualization tool (like Power BI or Tableau). SQL is non-negotiable; Python is often a "nice-to-have" for freshers.
Write clearly and talk through your logic out loud. Interviewers care more about your thought process than a forgotten semicolon. Say, "First I need to SELECT these columns, then I will JOIN the tables on the ID key..." so they can follow your logic even if your syntax isn't perfect.
A Data Analyst looks at historical data to explain what happened and why (descriptive and diagnostic analytics). A Data Scientist uses advanced statistics, predictive modeling, and machine learning to predict what will happen in the future (predictive analytics).
Always default to business professional or smart business casual. A well-fitted suit or a crisp button-down shirt with trousers shows you respect the opportunity and are ready for a professional corporate environment.
ETL stands for Extract, Transform, Load. It is the process of pulling data from a source (Extract), cleaning and formatting it (Transform), and placing it into a centralized database or data warehouse for analysis (Load).
Exactly one page. Highlight your technical skills at the top, followed by specific academic or personal data portfolio projects (with links), your education, and any internships. Remove irrelevant high school hobbies.
Data cleaning involves standardizing formats (e.g., ensuring all dates follow the MM/DD/YYYY format), removing duplicate entries, handling missing values (Nulls), and fixing spelling inconsistencies before analysis begins.
A primary key is a specific column (or set of columns) in a database table that uniquely identifies every individual record in that table. It cannot contain NULL values and must be completely unique (e.g., an Employee ID or Transaction ID).
Yes, unless explicitly forbidden. Real analysts use search engines for syntax daily. The test is designed to see if you can solve the business logic and structure the code properly, not to test your memory of exact function parameters.
Confidence comes from preparation. Practice your technical definitions, know your academic projects inside out, and frame your lack of experience as "high coachability and a strong eagerness to adapt to the company's workflows."